
Single mode — test one asset
Single mode models one stock or index over time. Set four inputs: an initial investment (a one-time deposit), a monthly contribution (recurring buys), and a start and end date. Set the monthly amount to zero for a pure lump-sum test; set the initial deposit to zero for a pure dollar-cost-averaging test.
Pick the asset from the grouped buttons (Index, Chips, AI Power, Watchlist, Speculative), then press Run simulation. The dark results panel separates total cash invested from ending value, and the chart plots cash invested (teal) against portfolio value (gold) at each monthly close.
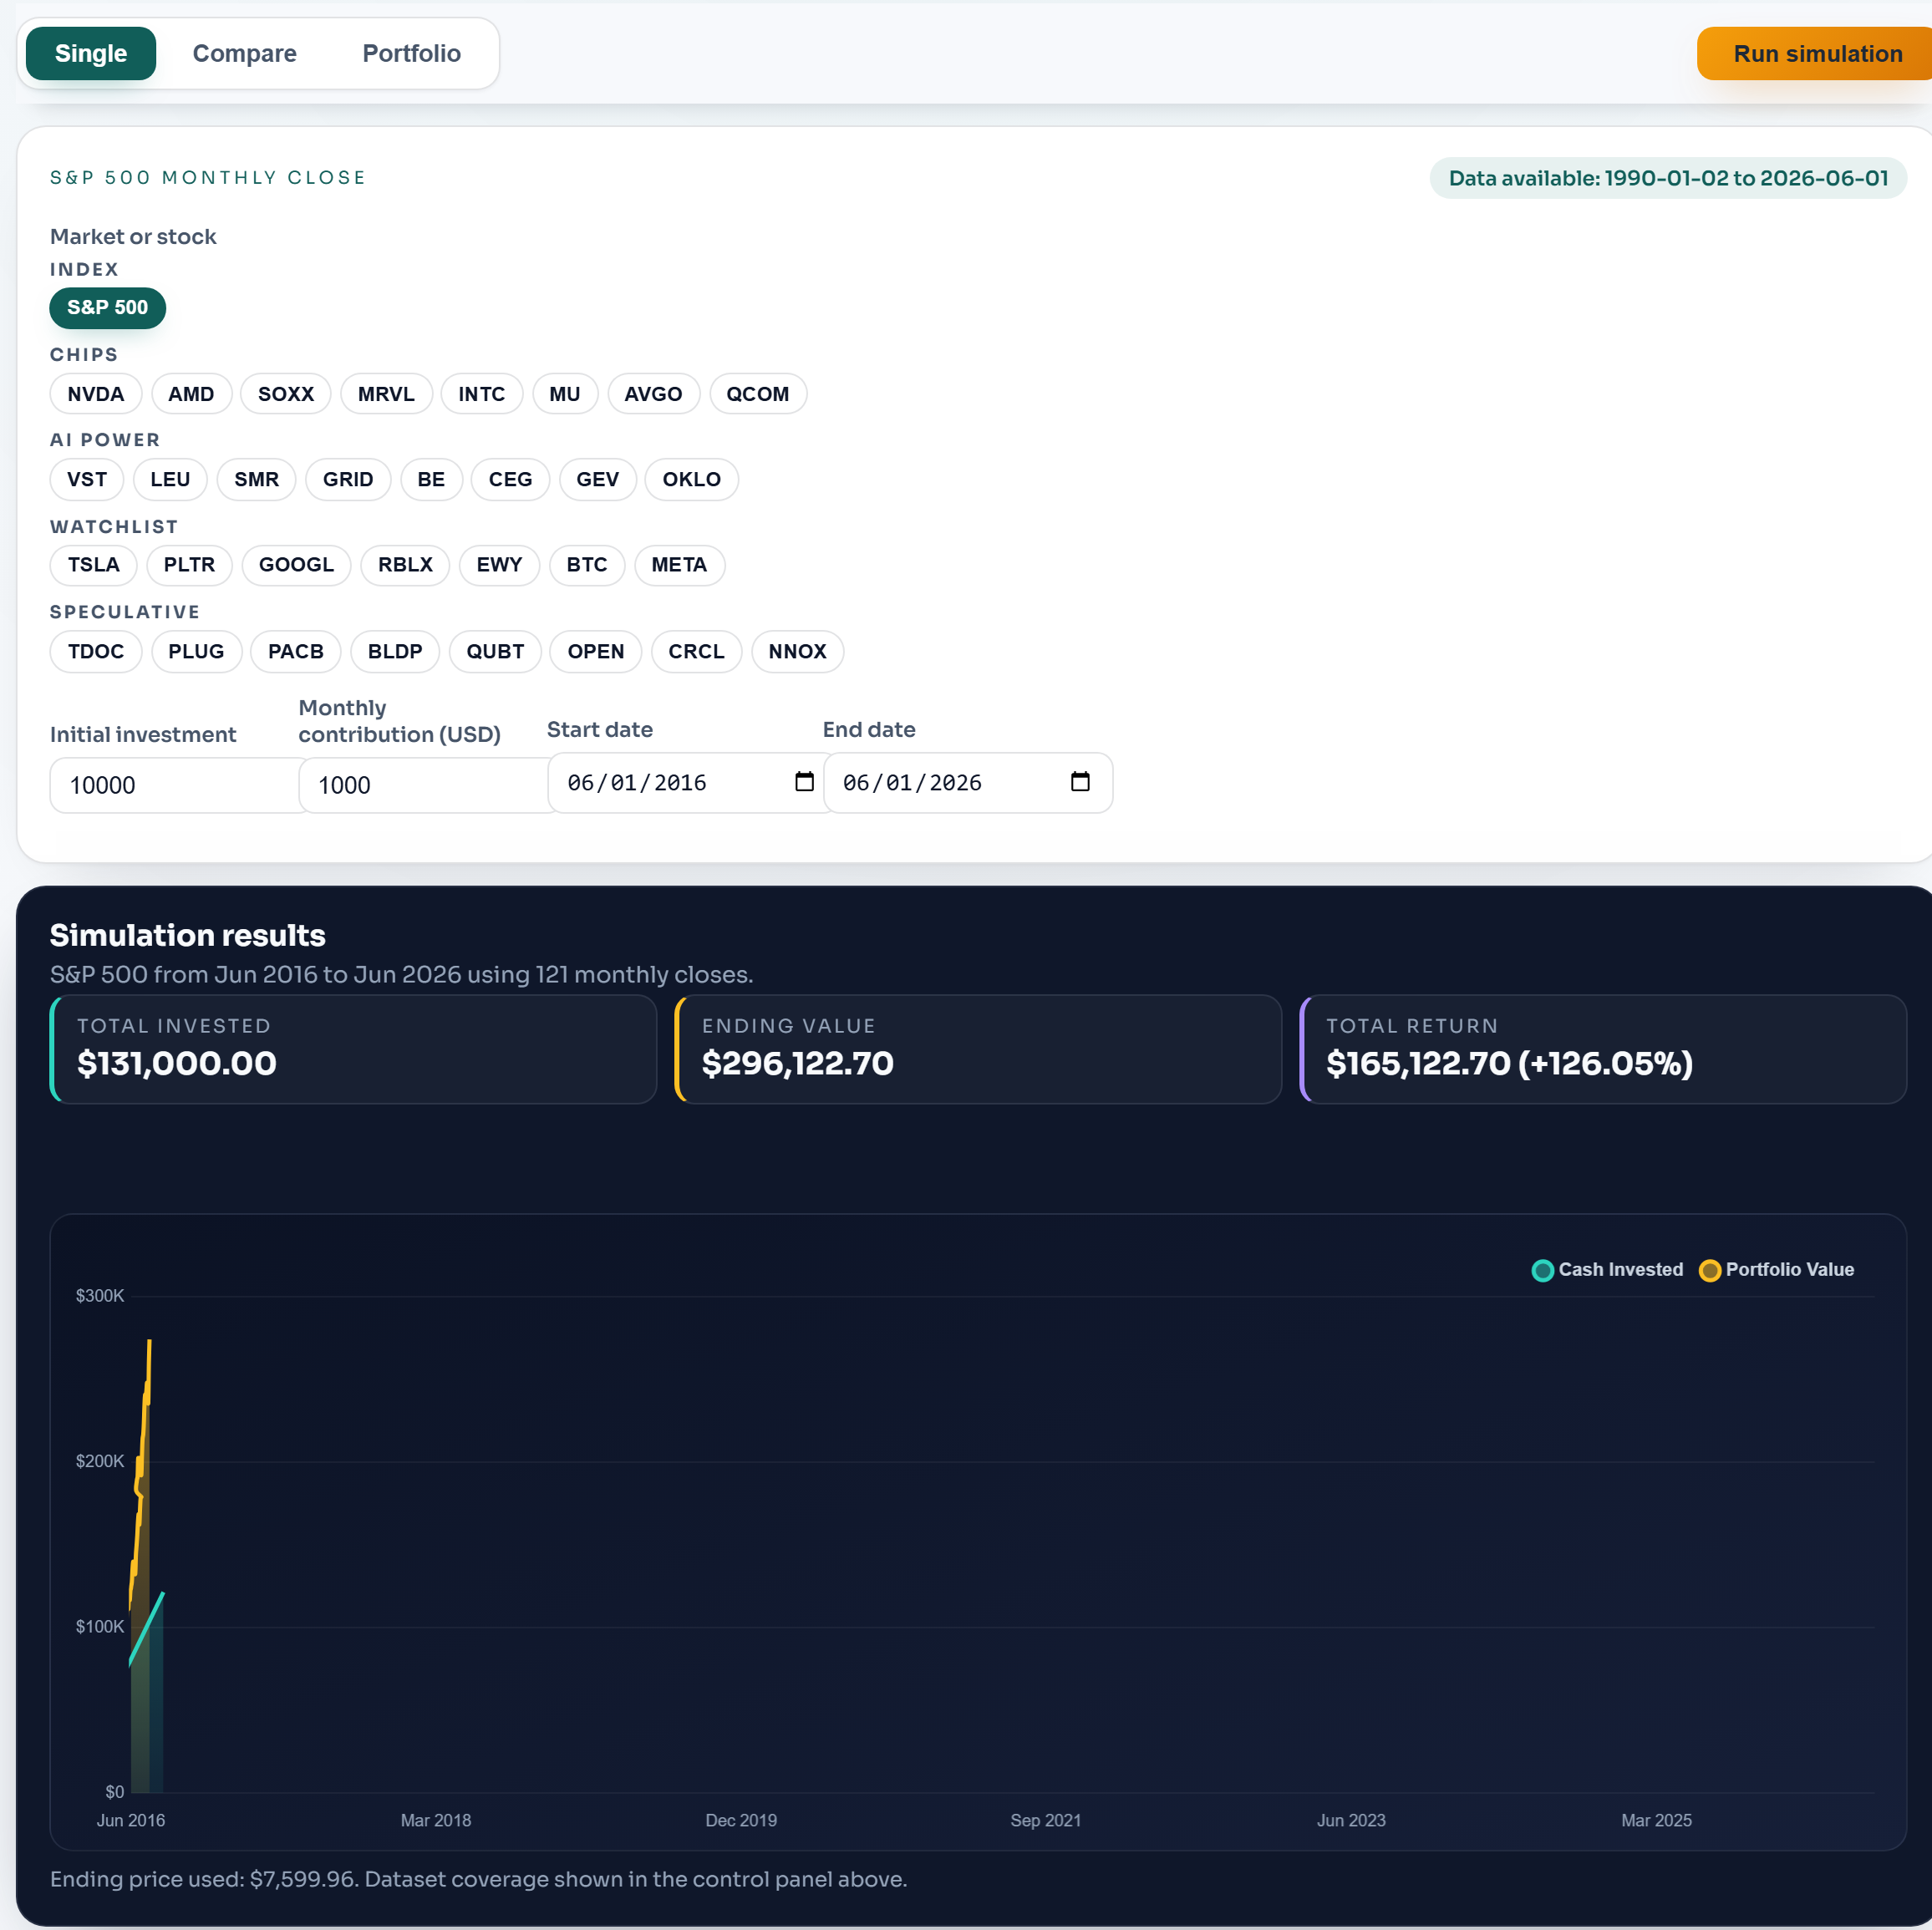
Contributions buy fractional units at the first available trading-day observation each month, so the ending value reflects every monthly buy compounding to the end date.
Initial and monthly deposits both start at the first selected observation, and monthly deposits include the final observation. Adjusted stock prices may reflect dividends; the S&P 500 benchmark is price-only. See data methodology.