Analysis & Market Notes
Straight talk about what's actually moving the market — company breakdowns, where the trend is heading, quick takes when something breaks, and the chart-reading basics underneath it all. Every note sticks to real numbers and is written for a normal person, not a trading desk. When a note covers a stock or theme, open the simulator and replay that stretch to see the figures yourself. It's all educational — none of it is advice.
 Deep Dives
NVIDIA at $5 Trillion: A Plain-English Deep Dive Into the Buy-or-Sell Debate
NVIDIA became the first $5 trillion company — yet its P/E sits below its own 10-year average. What it actually sells now, the latest numbers, the moat, and the real bull-versus-bear case.
Read post →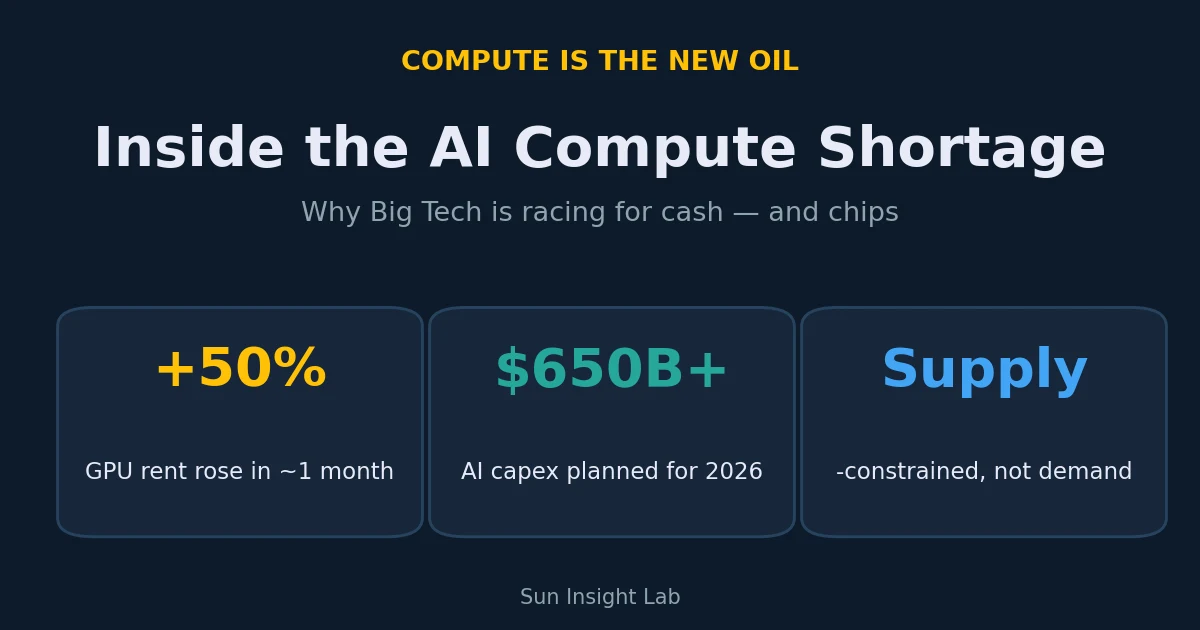 Market Trend
Google Paid 50% More for the Same AI Chips in 30 Days — Inside the Compute Shortage
Compute has become the new oil. Why Google happily paid 50% more for GPUs in a month, the wave of mega-raises that drained market liquidity, and what it means for investors.
Read post →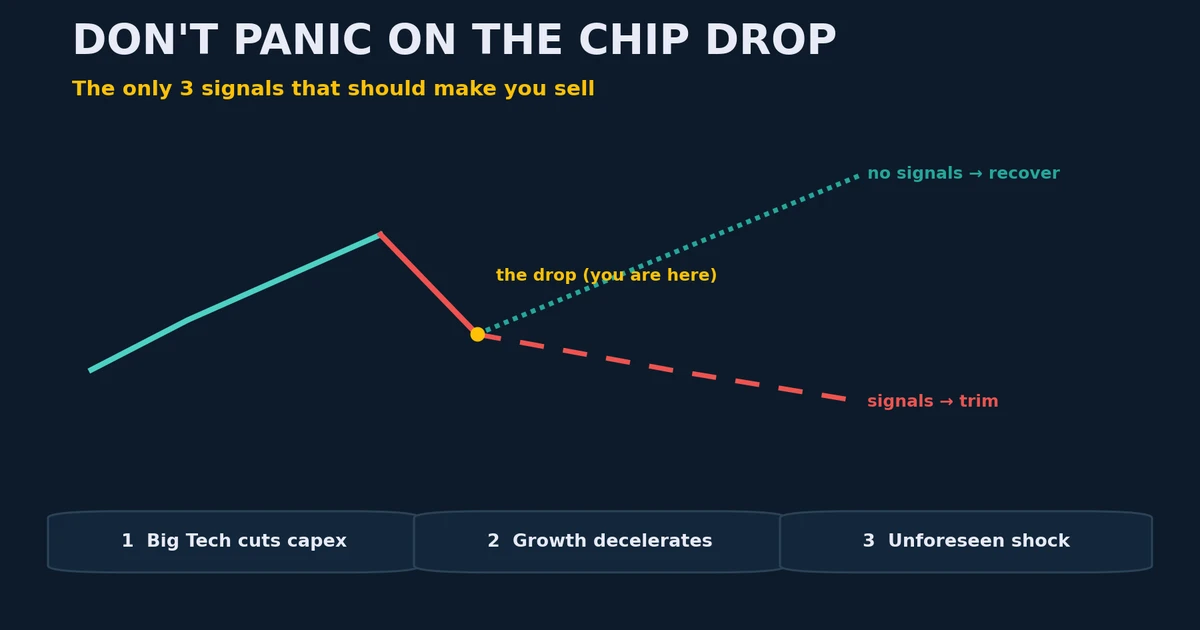 Breaking
Chip Stocks Just Tanked — The Only 3 Signals That Should Make You Sell
US semis sold off hard, but a falling price isn’t a sell signal by itself. The only three signals that actually justify trimming AI/chip exposure — with a checklist.
Read post →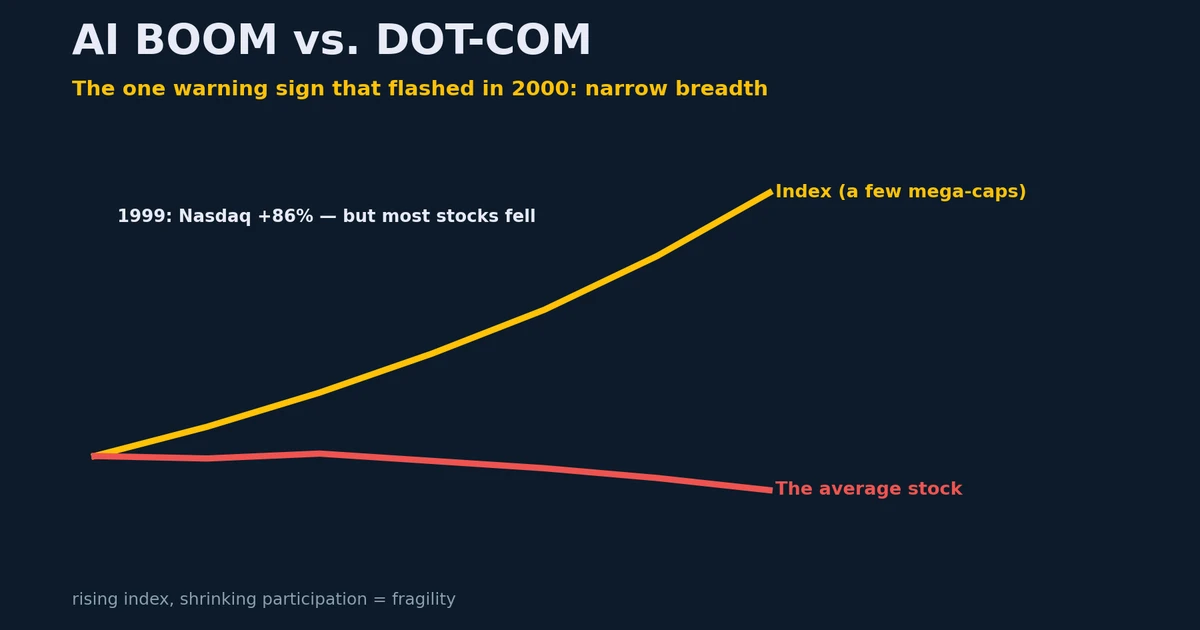 Breaking
AI Boom or Dot-Com Repeat? The One Warning Sign That Flashed in 2000
The useful dot-com comparison isn’t the rally — it’s that breadth narrowed first. How to watch for the same signal in today’s AI boom: few names, few countries doing the work.
Read post →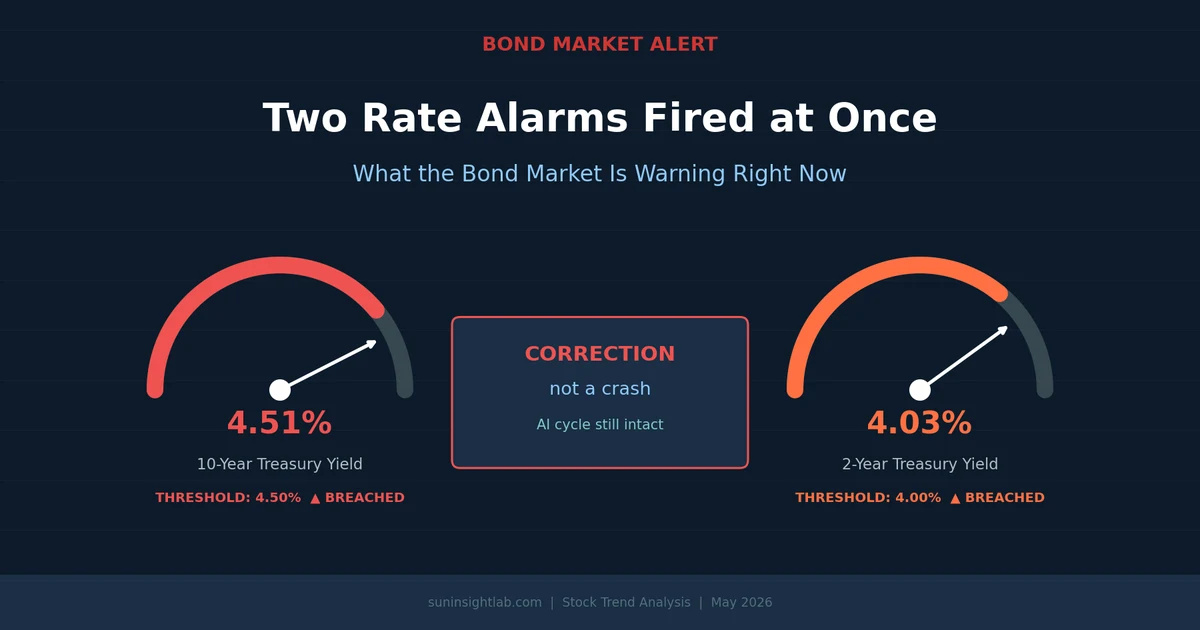 Market Trend
The Two Yields That Just Rattled Every Stock Portfolio
The 10-year Treasury broke 4.5% and the 2-year broke 4% on the same day. What those two alarms mean together, why it’s a correction and not a crash, and how to think about your portfolio.
Read post →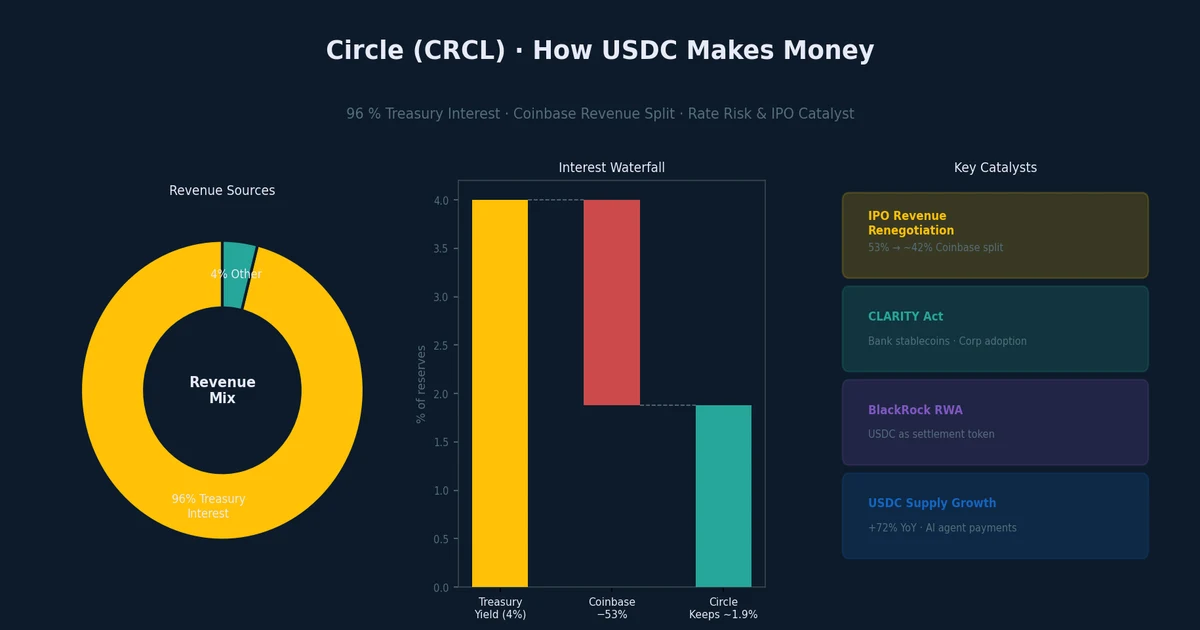 Deep Dives
Circle Isn’t a Crypto Company — It’s a Treasury Bill Fund
Circle earns almost all its revenue from Treasury interest on USDC reserves. How that business works, what the Coinbase revenue split really costs them, and the catalysts that could reshape the profit picture.
Read post →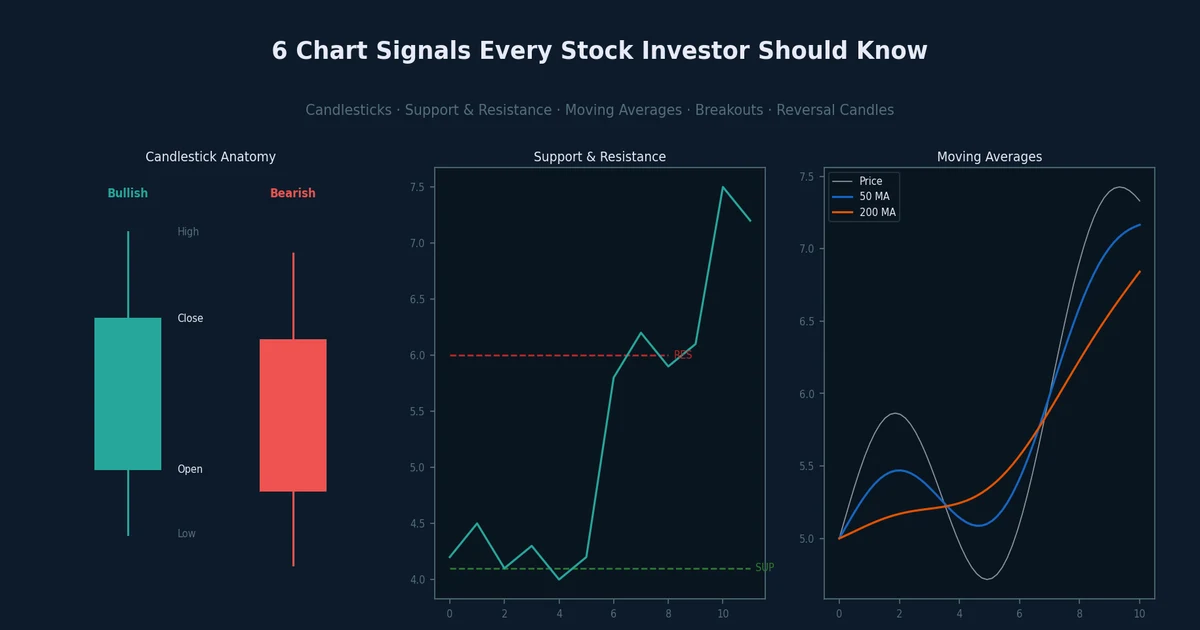 Basics
Reading Stock Charts: Start With These 6 Signals
Six things every investor should know how to read on a chart — candlesticks, support and resistance, trend types, moving averages, and the three patterns that most reliably signal a new uptrend.
Read post →New — the AI Bubble Meter: a live breadth & concentration gauge that scores how narrow the S&P 500 rally is, built from the dot-com lesson in our breadth post.
Test what you read: open the simulator, pick the assets a post discusses, and set a matching date range to see the historical figures for yourself.