Sun Insight Lab
Backtest Investing Strategies on Real Market History
Free browser tools for testing investing ideas on real market history — no sign-up, no advice, just numbers you can check yourself.
Sun Insight Lab is a free, independent resource for everyday investors — part toolkit, part plain-English commentary. The browser-based tools let you test investing ideas against real historical data, from a single stock to a full strategy across the S&P 500, while our market analysis helps make sense of what's actually moving prices. No sign-up, no advice — just a clear place to see how investing decisions play out over time.
Educational backtest of historical S&P 500 data — not investment advice. Uses the current S&P 500 membership and current shares applied back through history (a survivorship/share approximation — small for market cap, but it can inflate momentum returns). No taxes, fees, dividends, or slippage. Past performance does not indicate future results.
The toolkit
What you can test here
Six free tools, all built on the same checkable price history.
Investing simulator
Test a lump sum plus a monthly amount in one stock, an index, or a basket. Line up to five tickers side by side and flip rebalancing on or off.
S&P 500 factor lab
Sort the whole index by one trait — size, momentum, steadiness, value, or quality — hold the top names equally, and rebalance on a set schedule against the index.
Retirement calculator
Run long-haul contributions, including TSP and 401(k)-style accounts, and see how steady saving plus compounding shape the final balance.
AI Bubble Meter
A gauge for how narrow the S&P 500 rally has gotten — built on the old dot-com lesson that breadth fades before a top.
Market notes
Notes on what's really moving the market — deep dives, trend pieces, chart basics — each tied to a scenario you can replay in the simulator.
Learning library
Twenty no-jargon guides on risk, valuation, diversification, earnings, dividends, and the habits that matter more than picking the perfect ticker.
How it works
How the S&P 500 factor backtests work
The Quant Lab runs one simple experiment, over and over. Each rebalance it sorts every company in the S&P 500 by a single number, buys the top few (3, 5, or 10) in equal amounts, holds them, then re-sorts and trades again on a set schedule — monthly, quarterly, twice a year, or once a year. It puts your starting cash and monthly contributions to work the same way the simulator does, then draws the result against the S&P 500 doing the same thing. Hover over any month to see exactly what it was holding.
You pick which number it sorts by — five styles most traders know:
- Top-N Market Cap — the biggest companies. This rides the mega-cap names that have done most of the index's heavy lifting lately.
- Momentum — whatever has gone up the most over the past year. Winners tend to keep winning, but you trade a lot to stay in them.
- Low Volatility — the calmest, least jumpy stocks. They usually lag in a roaring bull market but hold up better when things turn.
- Value — the cheapest names by earnings yield, a stand-in for low P/E.
- Quality — the most profitable by return on equity, the businesses that squeeze the most out of each dollar of shareholder money.
Two things to be straight about. First, the test uses today's index members and today's share counts going back in time. For market cap that barely matters — the giants were already giants. For momentum it flatters the numbers, because the stocks that won big didn't look like winners back then. Second, there are no taxes, dividends, fees, or slippage in here. So read these results as a way to understand how each style behaves, not as money you could have actually pocketed. It's a learning tool — not advice, not a forecast. The exact buy-and-sell rules are spelled out in the help center.
Analysis
Latest analysis & market notes
 Basics
ETFs Explained: What You’re Actually Buying — and the 4-Point Checklist for Picking One
What an ETF actually is, why issuers keep launching new ones, the four numbers worth checking before you buy, and why leveraged and inverse funds lose money in ways their charts don't show.
Read post → Deep Dives
NVIDIA at $5 Trillion: A Plain-English Deep Dive Into the Buy-or-Sell Debate
NVIDIA became the first $5 trillion company — yet its P/E sits below its own 10-year average. What it actually sells now, the latest numbers, the moat, and the real bull-versus-bear case.
Read post →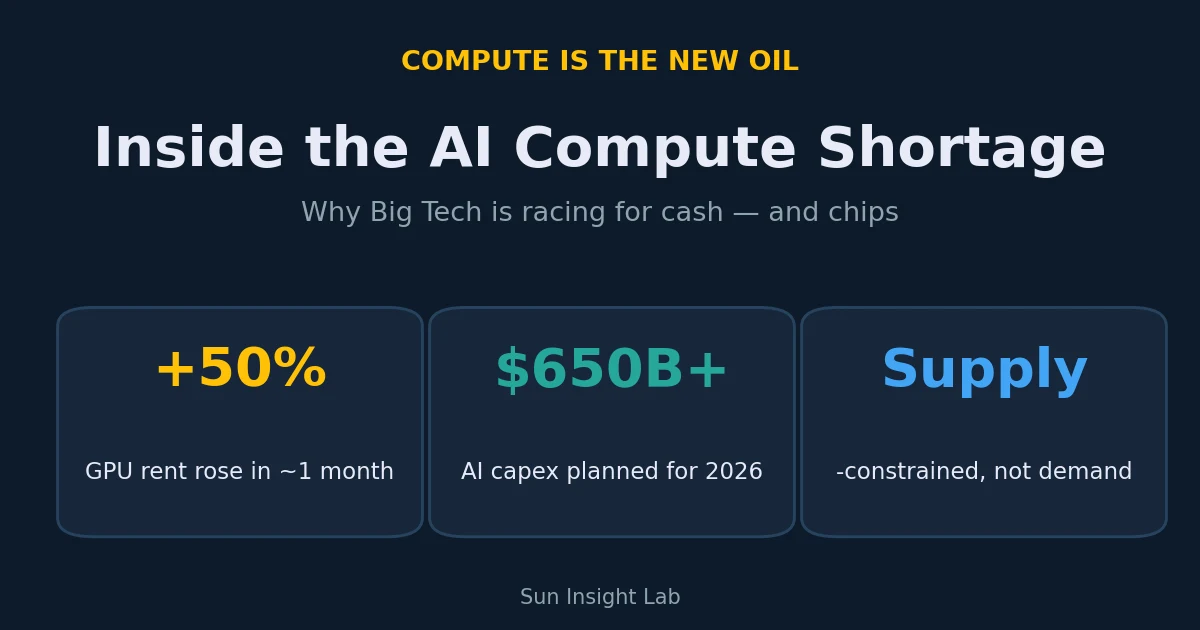 Market Trend
Google Paid 50% More for the Same AI Chips in 30 Days — Inside the Compute Shortage
Compute has become the new oil. Why Google happily paid 50% more for GPUs in a month (the “time value of compute”), the wave of mega-raises that drained market liquidity, and what it means for investors.
Read post →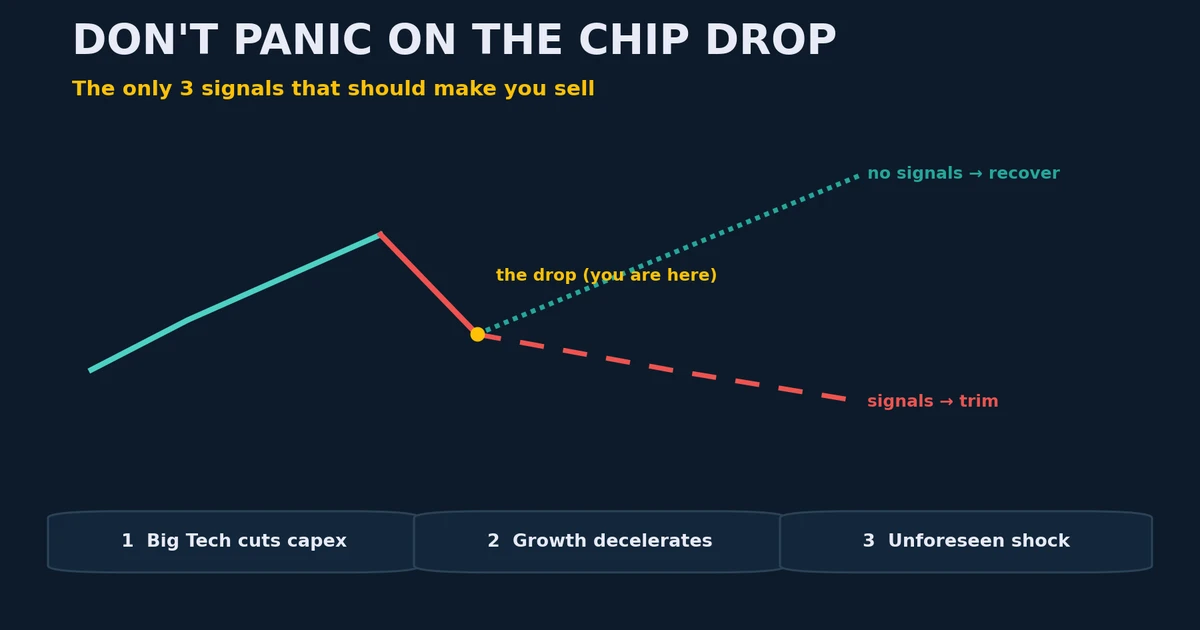 Breaking
Chip Stocks Just Tanked — The Only 3 Signals That Should Make You Sell
US semis sold off hard, but a falling price isn’t a sell signal by itself. The only three signals that actually justify trimming AI/chip exposure — with a checklist.
Read post →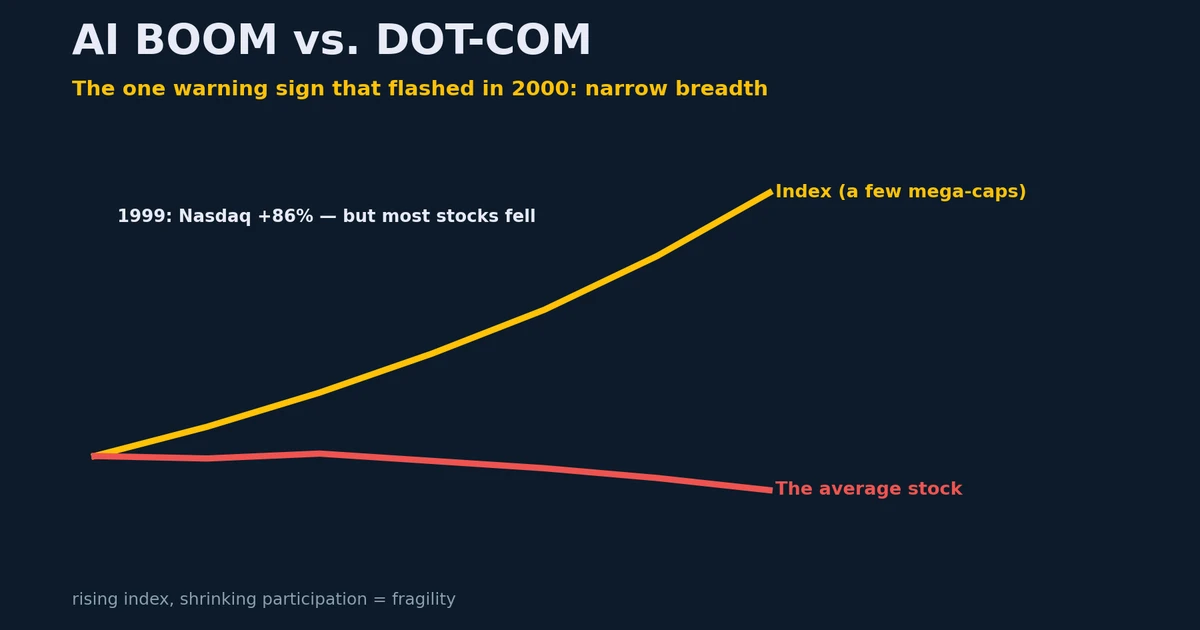 Breaking
AI Boom or Dot-Com Repeat? The One Warning Sign That Flashed in 2000
The useful dot-com comparison isn’t the rally — it’s that breadth narrowed first. How to watch for the same signal in today’s AI boom: few names, few countries doing the work.
Read post →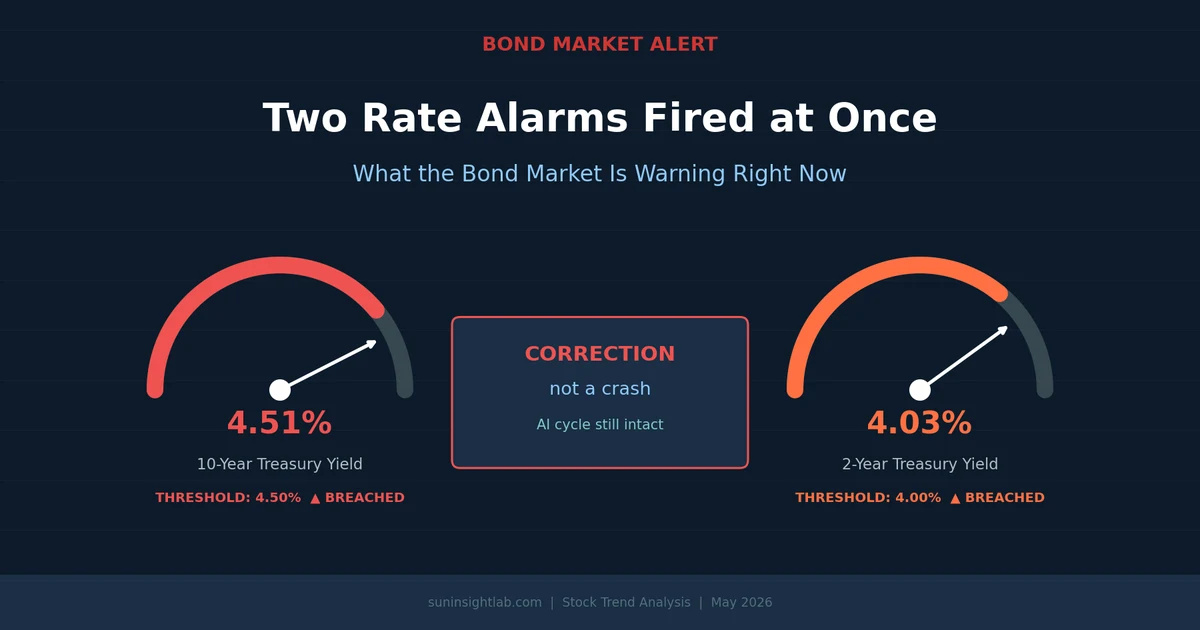 Market Trend
The Two Yields That Just Rattled Every Stock Portfolio
The 10-year Treasury broke 4.5% and the 2-year broke 4% on the same day. What those two alarms mean together, why it’s a correction and not a crash, and how to think about your portfolio.
Read post →FAQ
Frequently asked questions
Is it really free?
Yes. Everything here is free, runs in your browser, and needs no account. Nothing you type gets sent anywhere — the math happens on your own device.
What's a factor backtest, in plain terms?
It's a rule that sorts every stock in the S&P 500 by one trait — size, recent gain, steadiness, cheapness, or profitability — buys the top names in equal amounts, and rebalances on a fixed schedule. It shows how that kind of discipline would have done versus just holding the index.
Why does momentum look so good in the backtest?
Because the test uses today's S&P 500 members and today's share counts going backward. That's barely an issue for market cap, but it pumps up momentum — the stocks that won big were not obvious winners at the time. Read those returns as a teaching example, not something you could have captured.
Is any of this investment advice?
No. This is for learning, full stop. A backtest only tells you what a rule did in the past, and the past doesn't repay the future. Nothing here is a recommendation to buy or sell anything.