
Compare mode — five tickers side by side
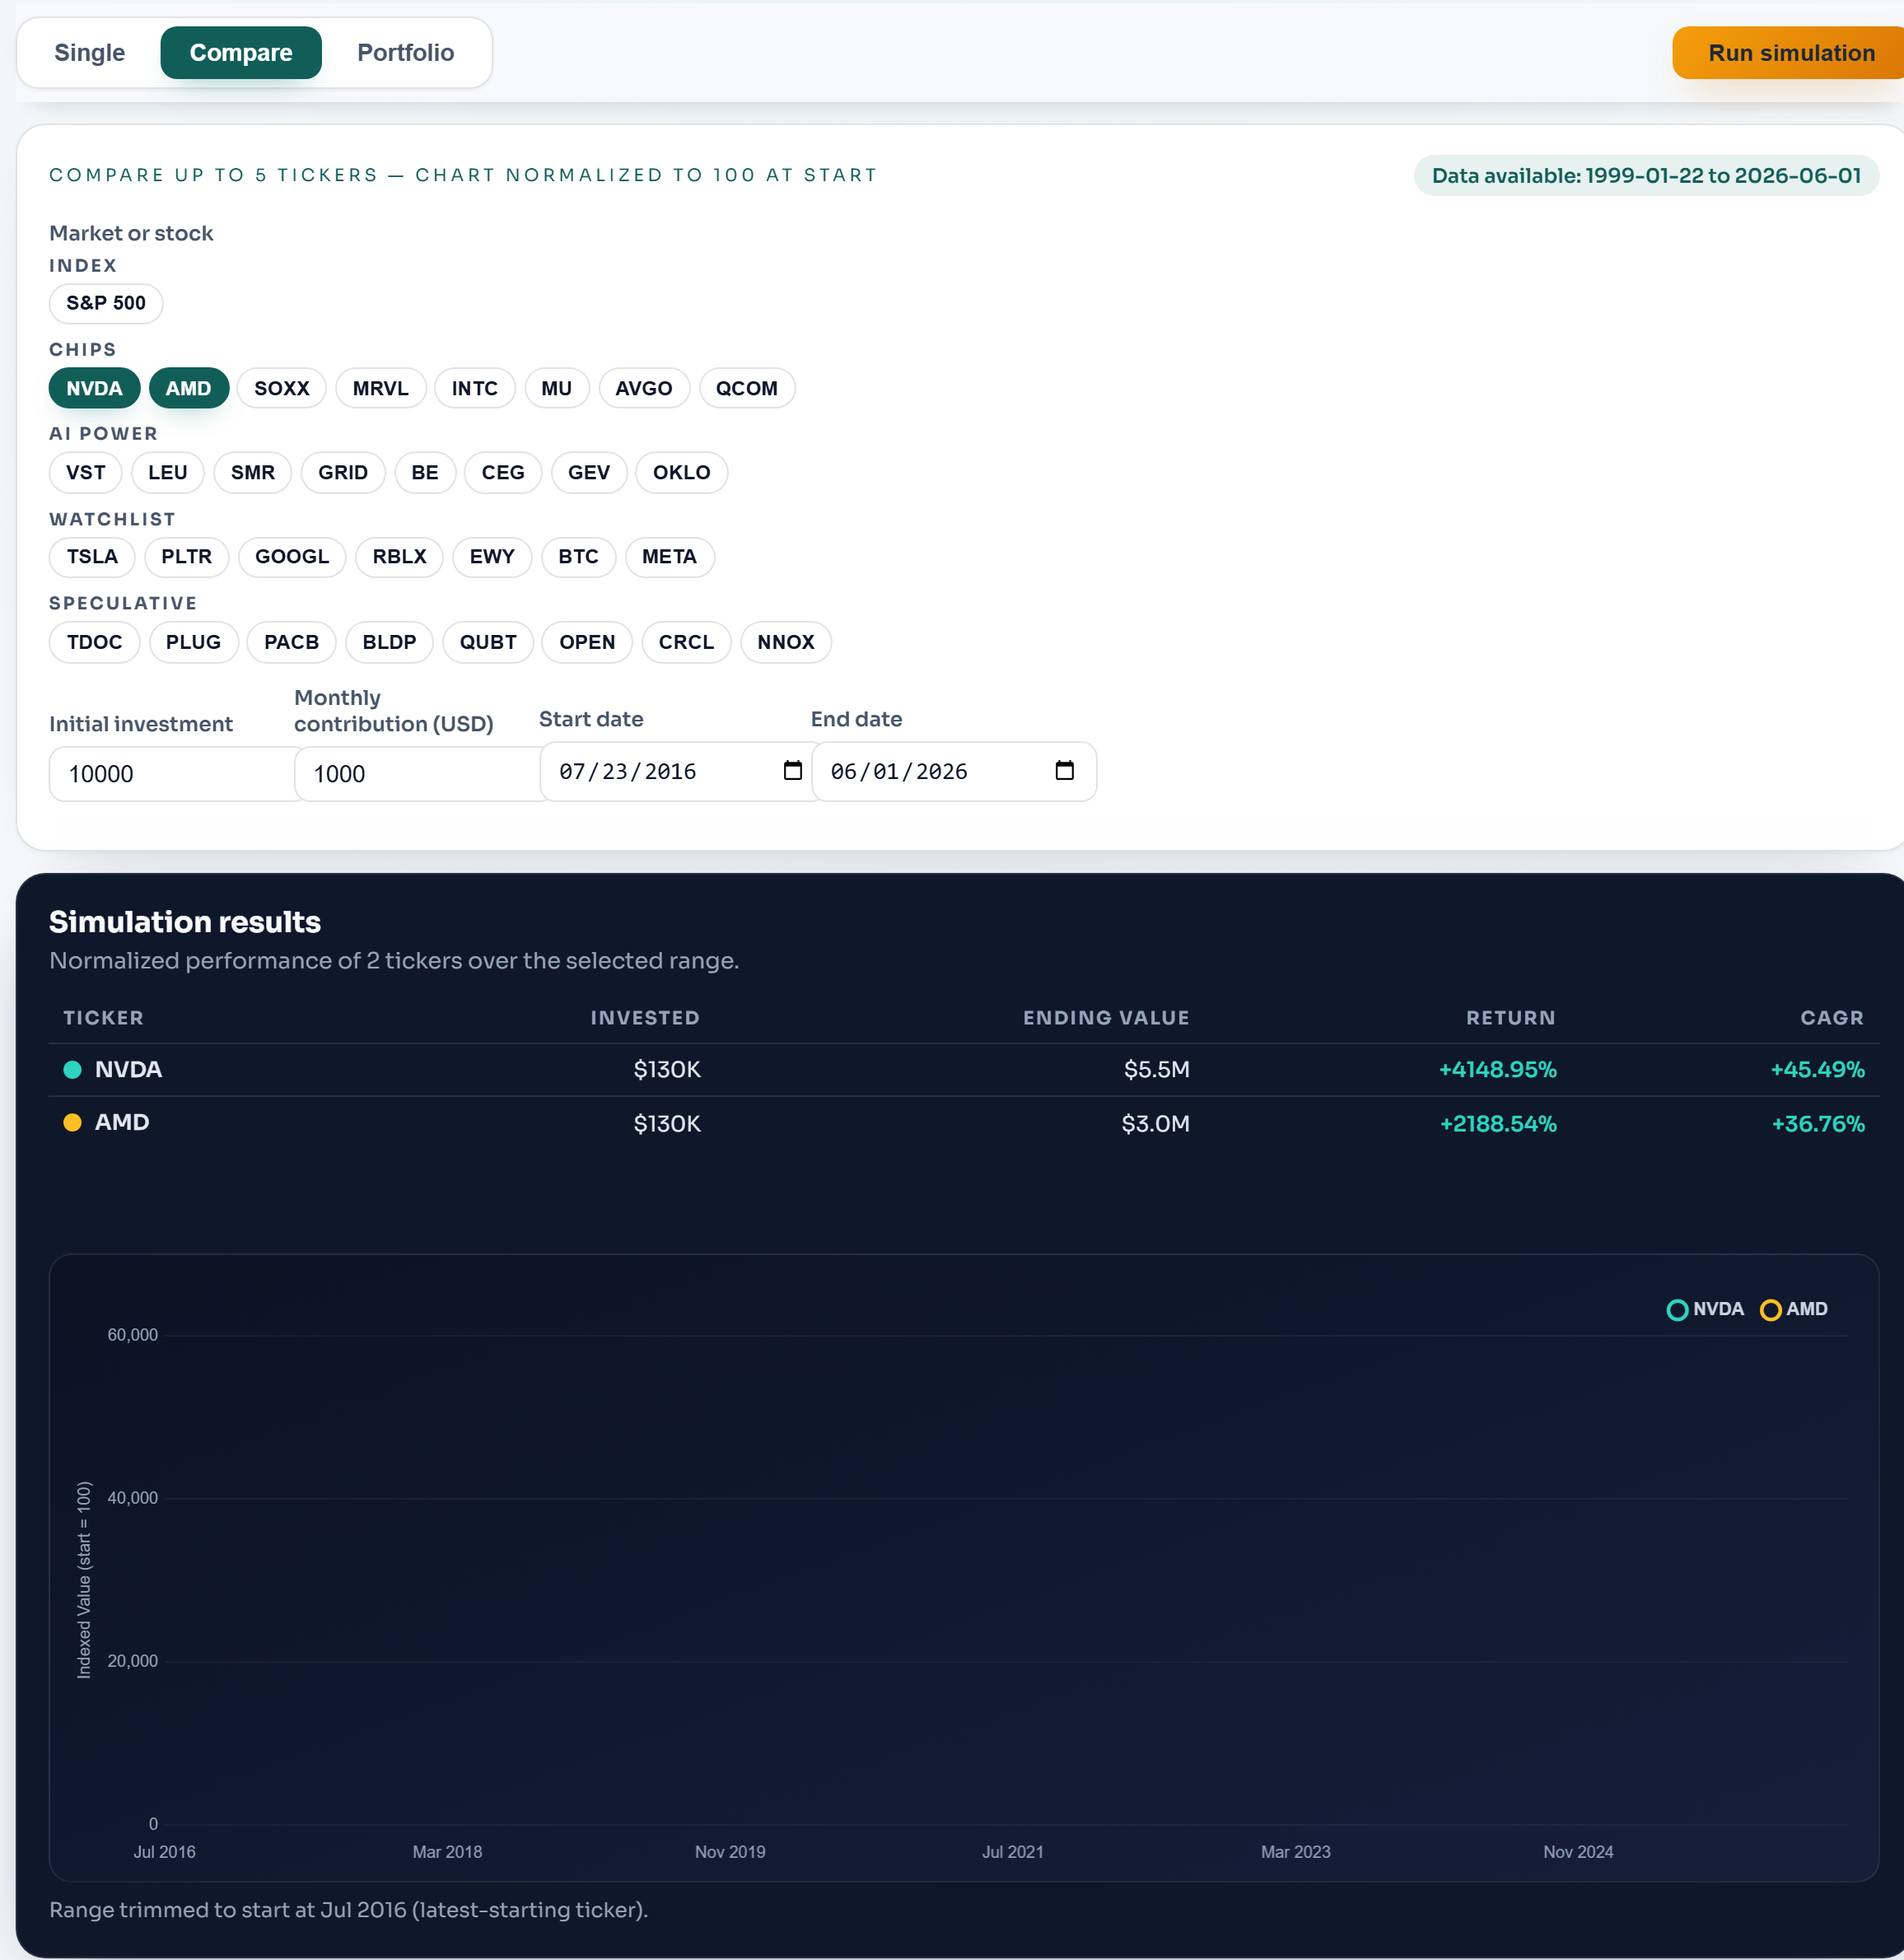
Compare mode normalizes every selected ticker to 100 at the start date, so you can read relative performance regardless of share price. Select up to five tickers from the buttons; the range trims automatically to start where the latest-starting ticker has data (noted under the chart).
The table reports each ticker's invested amount, ending value, total return, and per-year return (CAGR), with each line color-matched to its row. This is the fastest way to see dispersion — how far apart outcomes were inside one theme.
Compare is for relative reading; for dollar outcomes of a blended basket, use Portfolio mode.
Initial and monthly deposits both start at the first selected observation, and monthly deposits include the final observation. Adjusted stock prices may reflect dividends; the S&P 500 benchmark is price-only. See data methodology.